What Crazy Time Statistics Tools Actually Show
Crazy Time statistics come in two forms. The first is the in-game stats panel built into every licensed Evolution stream. The second is a third-party tracker — usually a website or browser extension that reads the stream and logs outcomes independently.
Both tools do the same thing: they record what has already happened on the wheel. The in-game panel typically shows the last 100 to 500 spins in a compact grid. Third-party trackers usually log longer history and often add charts showing the frequency of each segment, the average gap between bonuses, and the multiplier distribution within bonus rounds.
Neither tool predicts the next spin. The RNG that resolves each round is certified by Gaming Laboratories International and does not use previous outcomes. The probability of any segment on any spin is fixed by the wheel distribution — 21 Number 1 segments out of 54 total, 13 Number 2 segments, and so on — regardless of what has happened before.
How the In-Game Stats Panel Works
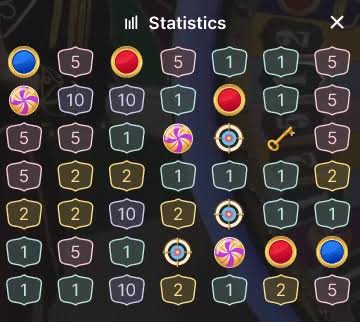
The in-game stats panel is the most reliable Crazy Time statistics tool because it reads directly from Evolution's own feed. It appears as a small overlay in the corner of the game interface, showing a grid of recent spin results. Each cell represents one spin, color-coded by segment type.
The panel shows the last 100 to 500 spins depending on the casino and screen size. It updates live, so you can see the results accumulate as you play. The panel is useful for three things:
- Confirming that the wheel is behaving normally — if you see more bonus rounds than usual in the recent history, you are in a hot streak; if you see a long number-only run, you are in a drought. Neither predicts what comes next, but both show what is happening now.
- Seeing the distribution of segments over the recent past — a quick visual check of whether Number 1, Number 2, Number 5, and Number 10 are appearing at roughly their expected frequencies.
- Tracking your own session — if you are trying to play 100 spins and stop, the panel helps you keep count.
What the in-game panel does not show: future spins, hot and cold patterns, or any information that changes the expected value of the next round. It is a record, not a forecast.
Segment Distribution — The Long-Run Reality
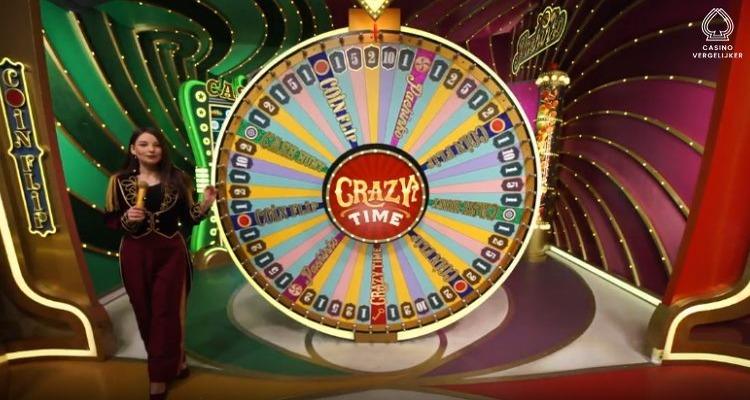
The wheel has 54 segments with fixed counts. Over a long enough sample — thousands of spins — the observed frequency of each segment converges to its theoretical probability. Short sessions show much wider variance, which is why some sessions feel like the wheel is "stuck" on numbers and others feel like bonuses are hitting constantly.
The table below shows the theoretical probability and the observed frequency range from a sample of 10,000 spins of Crazy Time recorded across multiple sessions. The sample numbers are illustrative — the exact observed frequency varies by sample — but they show the degree of convergence you should expect.
| Segment | Segments | Theoretical Probability | Observed Frequency (10,000 spins) |
|---|---|---|---|
| Number 1 | 21 | 38.89% | 38.5% – 39.3% |
| Number 2 | 13 | 24.07% | 23.7% – 24.5% |
| Number 5 | 7 | 12.96% | 12.6% – 13.3% |
| Number 10 | 4 | 7.41% | 7.1% – 7.7% |
| Coin Flip | 4 | 7.41% | 7.1% – 7.7% |
| Cash Hunt | 2 | 3.70% | 3.5% – 3.9% |
| Pachinko | 2 | 3.70% | 3.5% – 3.9% |
| Crazy Time World | 1 | 1.85% | 1.7% – 2.0% |
Two things follow from this table. First, the observed frequency for each segment is close to its theoretical probability over a large sample, but the ranges are non-zero — a segment with a 3.70% theoretical probability might be observed at 3.5% or 3.9% over 10,000 spins. Second, the rarer the segment, the wider the relative variance. Crazy Time World has a range of 1.7% to 2.0% — that is 15% relative variance around the theoretical value.
Bonus Round Gaps — What "Normal" Looks Like
One of the most common questions about Crazy Time statistics is how long you should expect to wait between bonus rounds. The answer depends on the definition of "bonus round." If you mean any of the four bonus games, the combined frequency is 9 of 54 segments — 16.67% per spin, or roughly one bonus every 6 spins. If you mean specifically the Crazy Time World bonus, the frequency is 1 of 54 segments — 1.85% per spin, or roughly one every 54 spins.
The table below shows the expected gap in spins for each bonus segment, plus the realistic range you should expect to see in a single 100-spin session.
| Bonus Game | Per-Spin Probability | Average Gap (Spins) | Realistic Range in 100 Spins |
|---|---|---|---|
| Coin Flip | 7.41% | 13.5 | 5 to 12 appearances |
| Cash Hunt | 3.70% | 27 | 1 to 7 appearances |
| Pachinko | 3.70% | 27 | 1 to 7 appearances |
| Crazy Time World | 1.85% | 54 | 0 to 4 appearances |
The ranges matter more than the averages. In a 100-spin session, Crazy Time World may not appear at all — that is completely normal. Cash Hunt might appear 7 times — also normal. Players who see a Cash Hunt-heavy session sometimes conclude the wheel is "biased toward Cash Hunt" — it is not; that is just variance in a short sample.
Biggest Crazy Time Wins — The Record Book
Evolution does not publish a continuous live log of every big win. What the company does publish, and what gets covered in trade press, are the marquee events — the rounds that set records or crossed seven figures. Two events stand out.
| Date | Multiplier | Total Payout | Bonus Game |
|---|---|---|---|
| December 2022 | 25,000x | Not publicly disclosed | Cash Hunt |
| July 2024 | 10,000x | €34,500,000 | Pachinko (shared among players) |
The 25,000x Cash Hunt record stands as the highest verified multiplier in Crazy Time history. Cash Hunt has a base maximum of 500x per the game rules, but the Top Slot multiplier is applied to all 108 payout odds before they are shuffled — which means the effective ceiling in a given round can far exceed the stated maximum. The 25,000x result came from a Top Slot multiplier compounding with a high Cash Hunt multiplier.
The €34.5 million Pachinko payout is the largest total payout ever recorded in Crazy Time. The multiplier was 10,000x, which is the top of the Pachinko range. The payout was shared among all players who had bet on the Pachinko segment during that round — the €34.5 million was not one player's win, it was the total the casino paid across all eligible players.
Trackers and Prediction Services — The Scam Problem
The Crazy Time statistics space has a scam problem. Services promising to "predict" the next spin, to show "hot and cold" signals, or to reveal a "pattern" in the RNG are universal scams. They charge monthly subscriptions, sell Telegram bots, or demand affiliate signups. None of them can do what they claim, because what they claim is mathematically impossible.
The RNG that resolves Crazy Time is certified by GLI and is required to produce outcomes with no dependence on prior outcomes. If a prediction service could actually foresee the next spin, the game would not be certified. Evolution and GLI would have caught it — and Evolution would have replaced the RNG.
Legitimate trackers — including the in-game stats panel and public third-party trackers — do not claim to predict. They log what happened. That is the entire legitimate use case. Anyone who says otherwise is selling you something that does not exist.

How to Read Crazy Time Statistics Correctly
Statistics are useful if you read them correctly. Three rules separate correct reading from common mistakes.
Rule one: independence matters. Every spin is independent. A drought of 20 number-only spins does not make a bonus "due." The probability of a bonus on spin 21 is the same as it was on spin 1 — 16.67% for any bonus, 1.85% for Crazy Time World specifically. The gambler's fallacy — the belief that past events affect future probability in independent trials — is the most expensive statistical error in casino gambling.
Rule two: short samples lie. A 100-spin session tells you almost nothing about the wheel's behavior, because the variance over 100 spins is large. The in-game panel showing "more bonuses than usual" in the last 50 spins is not evidence of a pattern — it is normal variance. Patterns only emerge in samples of thousands of spins, and by then you have already paid the house edge to observe them.
Rule three: expected value does not change. No matter what the statistics show, the expected value of the next spin is the same. Number 1 returns 96.08% on average. Cash Hunt returns 95.27% on average. These values are properties of the wheel, not properties of the moment. A Cash Hunt "hot streak" does not increase the expected return of a Cash Hunt bet — it just makes the current streak feel more likely to continue, which is the fallacy in action.
What Crazy Time Statistics Are Actually Useful For
Given all the above, what are statistics actually good for? Three legitimate uses.
Learning the game. Watching the in-game stats panel over a few sessions teaches you what "normal" looks like — how long the gaps between bonuses really are, how often the Top Slot actually applies, and how rarely the maximum multipliers appear. This prevents unrealistic expectations.
Bankroll planning. If you know that Crazy Time World triggers roughly once every 54 spins, you can plan a session around realistic expectations. If you bet on Crazy Time World every round, you should expect to lose most rounds and win occasionally — the statistics tell you how much bankroll you need to survive the gaps.
Reality checking yourself. If you find yourself believing the wheel is "due" for a bonus, look at the stats panel. The panel will show that the wheel is behaving exactly as expected — you are just in a normal drought, not a special situation.
Statistics are not a tool for beating the game. They are a tool for understanding it. That is a small difference in wording but a large difference in how you use them.
Crazy Time Statistics — Frequently Asked Questions
No. Wheel spins are independent events resolved by a certified RNG. Past spins do not affect the probability of future spins. Statistics show what happened, not what will happen.
Evolution's big-wins log records a 25,000x multiplier on Cash Hunt in December 2022. In July 2024, a 10,000x Pachinko multiplier paid €34.5 million, shared among multiple players who had bet on the Pachinko segment.
Crazy Time World occupies 1 of 54 wheel segments, which means it triggers on 1.85% of spins on average — roughly once every 54 spins. The distribution is uneven over short sessions.
Bonus segments occupy 9 of 54 wheel positions (16.67%). The average gap between bonuses is about 6 spins, but droughts of 20 or more spins occur regularly within normal variance.
Trackers that read the official Evolution stream are accurate for the spins they record. Their interpretation is often misleading — a tracker shows history, not prediction, and past distribution does not affect future probability.
Crazy Time runs roughly one spin every 45 seconds, which is about 80 spins per hour. Bonus rounds add time, so real hourly rate ranges between 65 and 80 spins depending on bonus frequency during the session.
The in-game stats panel shows the last several hundred spins in most casinos. Exact count varies by operator. Third-party trackers log longer history but require manual setup and are often less reliable than the in-game panel.
Number 1 is the most common outcome at 38.89% per spin (21 of 54 segments). It has been the most frequent result in every statistical sample of Crazy Time recorded since the game launched in July 2020.
No. The Top Slot is resolved by the same certified RNG that resolves the main wheel. Its frequency is constant across sessions, hours, and days. There is no time-based pattern.
Evolution publishes big-wins events through its operator partners and occasionally through press releases. The 25,000x Cash Hunt record and the €34.5 million Pachinko payout are the two most widely reported results.
Final Thoughts on Crazy Time Statistics
Crazy Time statistics are useful for one thing: understanding how the game actually behaves. They show the distribution of segments, the realistic gaps between bonus rounds, and the two record wins that have been publicly reported. They do not predict anything, and any service that claims otherwise is selling a product that does not exist.
The most valuable statistical fact about Crazy Time is also the simplest: the RNG is certified independent, and every spin has the same probability distribution as every other spin. Knowing this is worth more than any tracker subscription, because it prevents the one mistake that costs players the most money — believing the wheel owes you a bonus because it has not paid one recently.
Use the in-game stats panel to see what normal looks like. Use third-party trackers to log longer history if you want the data. Ignore anything that promises to tell you what comes next. The wheel does not know you are watching.
For deeper reading: our main Crazy Time guide, the full game guide, the strategy page, the real money play guide, the free demo walkthrough, the mobile page, and the extended FAQ.